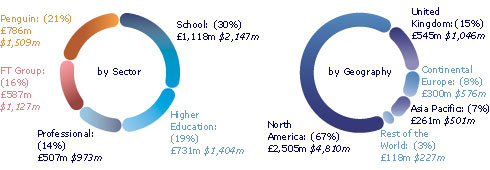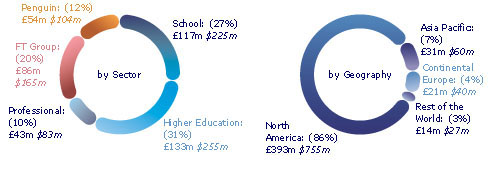


Note: United Kingdom operating loss excluded = £(26)m $(50)m.
*Continuing businesses (excluding Recoletos).
| 2004 £m |
2004 $m |
2003 £m |
2003 $m |
Underlying change % |
|
|---|---|---|---|---|---|
| Sales(1) | 3,729 | 7,160 | 3,879 | 7,448 | 3 |
| Business performance | |||||
| Adjusted operating profit(1,2) | 433 | 832 | 462 | 887 | 7 |
| Adjusted profit before tax(2) | 386 | 741 | 410 | 787 | |
| Adjusted earnings per share(2) | 30.0p | 57.6¢ | 32.0p | 61.4¢ | |
| Free cash flow(1,2) | 279 | 536 | 188 | 361 | |
| Return on invested capital | 6.2% | 6.3% | 0.3%pts(3) | ||
| Statutory results | |||||
| Operating profit | 231 | 444 | 226 | 434 | |
| Profit before tax | 171 | 328 | 152 | 292 | |
| Basic earnings per share | 11.1p | 21.3¢ | 6.9p | 13.2¢ | |
| Dividends per share | 25.4p | 48.8¢ | 24.2p | 46.5¢ | |
| Net borrowings | 1,206 | 2,316 | 1,361 | 2,613 | |
(1) Continuing businesses (excluding Recoletos: sales (2004: £190m; 2003: £169m), operating profit (2004: £22m; 2003: £28m)).
(2) Before goodwill (2004: £(224)m; 2003: £(264)m) and non-operating items (2004: £9m; 2003: £6m).
(3) At constant currency.
1. Growth rates are on an underlying basis, excluding the impact of currency movements and portfolio changes. In 2004, currency movements reduced revenues on a continuing business basis by £302m and profits by £51m while portfolio changes increased revenues by £41m and reduced profits by £8m.
2. Adjusted figures are stated before goodwill, integration costs and non-operating items. Goodwill is amortised over no more than 20 years.
3. The 'business performance' measures, which Pearson uses alongside other measures to track performance, are non-GAAP measures for both US and UK reporting. Pearson uses these measures because we consider them to be most useful for tracking underlying business performance. Reconciliations of operating profit, adjusted earnings per share and operating free cash flow to the equivalent statutory heading under UK GAAP are included in notes 2, 9 and 27 of the governance and financial statements.
4. The value of the dollar has been translated at the year end rate; $1.92: £1 sterling.